Create interactive AWS Architecture Diagrams with Arcentry
Amazon Web Service architectures can get complex - really complex. Diagrams are a great way to break through this complexity and communicate concepts visually - but it's crucial to find paradigms that work both structurally and semantically. That's why Arcentry comes with semantic representations of everything living within the Amazon Cloud:
Take for instance our own architecture:
-

Icons, Security Zones, Gateways and more
Arcentry comes packed with ready-made components for all AWS services and concepts. From EC2 instances to container orchestration with ECS or Kubernetes, from security groups to VPNs and VPCs, Arcentry has you covered.
-

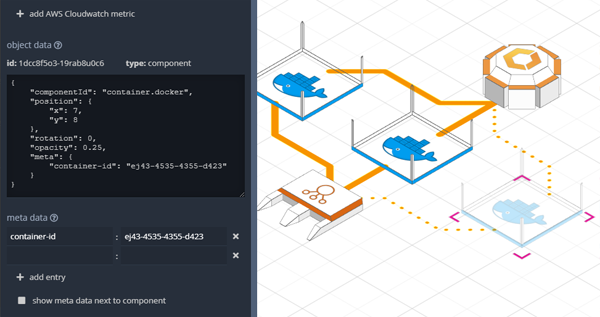
Fully integrated with Cloudwatch
Arcentry goes beyond static diagrams. Our infrastructure visualizations can stream realtime-metrics directly from Cloudfront and display them as charts and labels within the diagram. This allows to monitor complex infrastructures and see problems in their context. See a demo video here
-
Connect to the AWS API
Arcentry's comprehensive REST API allows you to change every aspect of a diagram programmatically. Integrate with the AWS SDK to visualize ECS Container Groups, EC2 utilization or Aurora throughput in realtime.
-
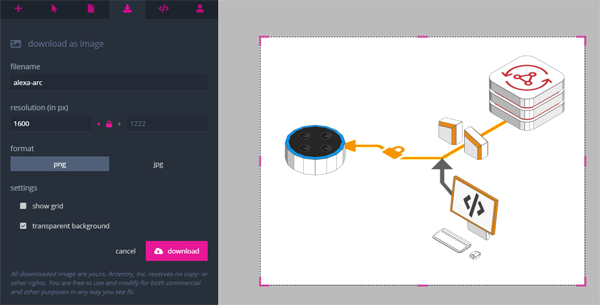
Embeddable Diagrams
You can export Arcentry's 2D and 3D diagrams as images in any resolution. Or - even better - you can embed them in our 3D viewer into blog posts, websites and even third-party monitoring dashboards like Grafana.
Get started
Arcentry comes with a free tier to play around and get a feeling for how it works. The paid plan costs $9.90 a month and can be cancelled at any time. To learn more, visit arcentry.com or sign up below to try it out yourself.