Automatic Diagram Creation
Arcentry's /create-diagram endpoint takes simple, flat infrastructure descriptions in JSON or CSV and automatically turns them into diagrams.
What would I use this for?
To easily visualize existing architectures, to document deployments and to turn infrastructure templates into diagrams.
Hold on, isn't there already an API for diagram creation?
Yes, using Arcentry's /doc/<doc-id>/* endpoints you can already create and manipulate components on a diagram in realtime. This is useful for interacting with existing diagrams (e.g., changing colors to indicate component state), but laying out a whole infrastructure this way can be cumbersome.
What's the future of this?
Now that we have a robust baseline for automated diagram creation we will gradually add converters for infrastructure data - e.g., templates like Terraform or AWS Cloudformation, reading live infrastructure from AWS, Google Cloud, Azure, and Co and integrating with infrastructure discovery software. If you have any particular use case in mind, please let us know at info@arcentry.com.
Example

To generate the diagram above, POST the CSV or JSON below (with content-type: text/csv or application/json) to https://arcentry.com/api/v1/create-diagram/<docId>.
Format for Automatic Diagram Creation
Structure
A flat list of components, their associated groups, connections, and other data. Each entry must have a unique id and a type. Additional fields depend on the type of the entry.
Data Format
Either CSV or JSON
Request Format
Data is sent via HTTP POST request to https://arcentry.com/api/v1/create-diagram/<docId>. A content-type header must be set to either application/json or text/csv. As with other API requests, authentication must be provided as either header or URL parameter.
Example Request reading data from a CSV filecurl \
--data-binary "@architecture.csv" \
-H "Authorization: Bearer 6b4f49e064e1537a050d06067fc6cac4342ec2e59cb43ff6b975a596331f31e9" \
-H "Content-Type: text/csv" \
-X POST \
https://arcentry.com/api/v1/create-diagram/25f2ff32-ccb3-3425-a86e-66c6c6b92a1c
Example Request sending data as JSON
curl \
-d '{"server-a":{"type":"component","componentType":"generic.server"},"server-b":{"type":"component","componentType":"generic.server"}}' \
-H "Authorization: Bearer 6b4f49e064e1537a050d06067fc6cac4342ec2e59cb43ff6b975a596331f31e9" \
-H "Content-Type: application/json" \
-X POST \
https://arcentry.com/api/v1/create-diagram/25f2ff32-ccb3-3425-a86e-66c6c6b92a1c
Margins, Paddings & Co
You can add query string parameter to your URL to specify how much space you'd like between components, tiers and groups, how much paddings your labels should have and many other settings. You can find a detailed list of available settings here.
Components
Components are the main building blocks of diagrams. In addition to id and type, each component must have a componentType, specifying what kind of component it is.
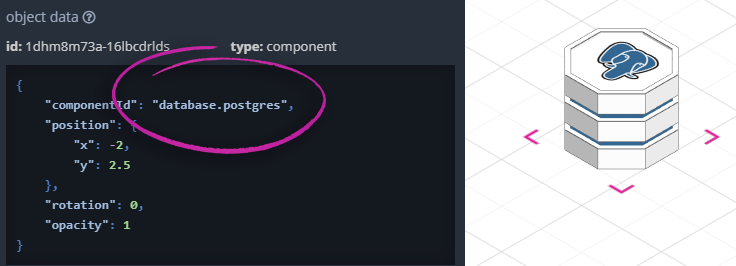
To find the type of a component in Arcentry, place it on the grid, select it and check the object-data box (only visible if API is activated) for componentId.
Connections
Connections specify the lines that connect components or groups with each other. Each connection field is an array of ids of other components or groups this component or group should connect to.
Please note - it's sufficient to specify connections once - e.g. if component a is connected to b, it's enough to specify connections: ['b'] for component a.
Arrows
You can add arrowheads to the end of specific or all connections originating at a given component or group by defining the arrowsTo setting. arrowsTo can either be set to all, causing all connections from this component to end in arrows or to an array of connections, e.g. ["server-a", "server-c"].
Groups
Groups allow you to specify areas around your components, e.g. to visualize VPN/VPCs, security zones, etc. Each component can be part of one or more groups.
Groups are defined as arrays (or comma-separated lists for CSV) of group ids. These group ids don't have to be explicit entries in the table - though adding them as entries allows you to specify labels and styling rules.
Nested Groups
Often, you have multiple layers of groups within your infrastructure. Say, a Virtual Private Cloud on AWS that contains multiple subnets which in turn are home to multiple components.
Arcentry makes it easy to specify this. Simple list all groups a component belongs to, separated by commas (in CSV) or as an Array (in JSON.
Important: Your list of groups must be ordered from parent to child, e.g. VPC-A, Subnet-A.
Tiers
Tiers define how diagrams are ordered from front to back. Usually, they don't have to be explicitly specified. Arcentry will order components based on their category as follows:
-
Tier 6 (all the way to the back):
ai, analytics & storage -
Tier 5:
databases -
Tier 4:
data-processing, monitoring, devops -
Tier 3:
media processing and message broker -
Tier 2:
server instances, container, computation and caching -
Tier 1 (Front of Web Stack):
security, api, networking -
Tier 0 (In Front):
IoT, Client Devices
At times, however, you want to order things differently. Maybe your server cluster is divided into multiple tiers amongst themselves; maybe your analytics live all the way at the front. You can easily overwrite the default tiering be specifying tier with any numeric index.
Labels
Labels can be added to components and groups. For components, simply specify label: "My label" in their definition. For groups, you'd need to create an additional entry with id:groupId and type:'group' and add the label there.
Btw, by default, Arcentry chooses a random color for groups and label backgrounds based on the name of the group. To change this, simply specify e.g. "lineColor": "#00FF00" as part of your group settings.
Styling
Every aspect of your diagram can be styled in any way you like. You can find an extensive list of all available properties here or simply style things in Arcentry's GUI and copy the properties you like from the object-data entry in the sidebar.
To apply styles, simply add them to your CSV along with id, type, groups, and all the other properties.
Metadata
Arcentry allows you to store meta-data such as instance ids, number of cores, memory, etc. alongside any component. You can find more about metadata here.
To add metadata to your generated diagrams, simply prefix your column-names or JSON keys with meta-. (This prefix will be removed before insertion).